The histogram step height mode is a complex and versatile tool can be used to measure a variety of different samples, such as those with multiple step heights, or samples that may not have a well-defined step edge.
To enable the histogram mode, click on the Step Height button in the top ribbon Analysis section, then click the Histogram tab in in the Step-Height Measurement side panel. |
 |
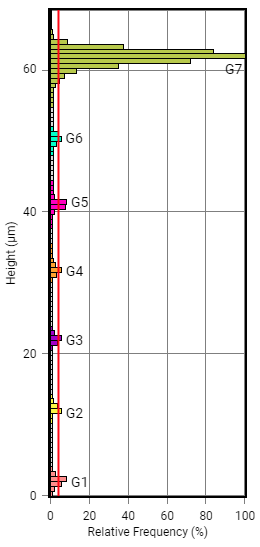 |
Once selected, ProfilmOnline presents the histogram for the current image. This graph shows the distribution of points in the data by height. The example to the left is from a user calibrating a dicing saw. Most of the points fall near the mid-60 micron range (the top of the sample) with small groupings roughly every 10 microns as they cut deeper into the sample. Parsing is based upon the settings below:
Minimum relative frequency is indicated by the red vertical bar in the data. In order for a height value to be identified as a histogram region, it must reach this minimum value. To set this value, enter a number into the text box, or click and drag the red bar. Click Update to apply changes. |
Number of bins defines how many histogram groupings are on the graph. A higher number is used to finely key in on sections with rapidly changing heights, while a lower number is used to hide noise from rougher surfaces. Any value over 160 will revert to continuous mode, which is the maximum resolution option.
Minimum Height Variation refers to the width of the histogram groupings. The higher this number, the wider a histogram region must be to become a group. Using the example on the left, a variation of 1% gives the results shown in the image. Increasing that value to 5% would exclude every group except G1, G5, and G7, and 10% would leave only G7.
Height Group Spread refers to the width for each histogram grouping. The default setting, Adjacent Minima, will include any columns in a grouping that exceeds the Minimum relative frequency and any adjacent columns until a minima is found on either side. Proportional to height range sets the width of the grouping proportional to its relative frequency. A frequency of 0% only select columns that exceed the minimum relative frequency. A frequency of 100% will select adjacent columns up to that grouping's greatest relative frequency.
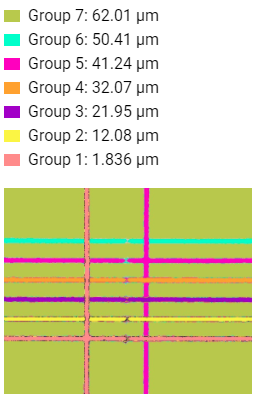
While separating and defining regions, they will each be labeled in different colors on both the histogram and the 2D plot inside the histogram, making it easier to see changes as they are applied.
With the regions defined, there are a variety of different data points shown on the right hand side of the panel. The first is a list of the average heights of each group relative to the currently selected Origin point. Below this is a 2D plot.
Below the 2D plot are two tables. The first is a table listing the average heights for each grouping relative to all other available groupings. The second table lists basic information about each layer: average, min and max height of the surface, azimuth, and inclination of the surface plane.